Catastrophic global events often lead to an increase in cases of fraud. This was evidenced in the 2008 recession, during which we statistically saw a significant rise in arson claims. We have seen the same trend since March 2020. However, we don’t look at every claim we investigate as potentially fraudulent because we’re in a recession.
A forensic expert needs to look at the physical evidence with no bias or preconceptions. Then, we must translate what this physical evidence expresses into a thorough report. This helps clients apply that information to their policy, whether to determine coverage, subrogation possibilities, or liability.
Background and discovery information
Every investigation starts with a collection of witness statements from the fire department and police reports. Discovery information also includes servicing history, history of the vehicle, and the vehicle’s performance before the fire. We ask for the vehicle accident history from the insured or through a CARFAX.
Photos are also invaluable during investigations. We ask for any pictures taken just before, during, and after the fire. It’s important to know what the reported condition and use of the vehicle were before the fire.
Before examining a vehicle, forensic experts also search for recalls, technical service bulletins, and blogs related to the vehicle’s year, make, and model. At times, an investigation will require the determination of the wind effects. In those cases, the vehicle orientation and fire time are crucial information. We will also want to know if the scene is still available for some fires.
Documenting vehicle fire scenes
The first step to documenting these scenes is confirming the VIN. If a VIN can’t be verified, a forensic expert will apply the same principles as structure fires. This means beginning the vehicle examination from the outside and working your way toward the most significant damage area. It’s crucial to note that the area of greatest damage isn’t always the area of origin; it could result from ventilation or fuel load.
If possible, the vehicle examination should take place at the fire scene. However, there is often a better possibility of origin and cause determination when examining a vehicle where the fire has happened for two reasons:
1. Surrounding fire patterns around the vehicle will show the wind effects and the surrounding fuel loads.
2. Evidence that has fallen from the vehicle can be retained. When a car is moved, evidence can be lost in the debris.
It’s often impossible to examine a vehicle at the fire scene because it has to be towed away if it’s being driven at the time. The process of documenting vehicle fire scenes stays the same no matter the circumstances. The more faithful we are to this process, the more vivid the evidence of fraud becomes, and the stronger the technical opinion of a forensic expert.
Total burns and stolen and recovered vehicles
When a vehicle has been burnt to a crisp (total burn) and stolen and recovered, crucial physical evidence is hard to analyze. However, several factors and techniques can significantly improve the evidence analysis.
Depending on the age of the vehicle, a locksmith can assist with door locks and ignition cylinders to see if a key was used. In addition, they often have access to the manufacturer’s specs and aftermarket security installations.
Depending on the extent of damage, the infotainment module may be downloaded and compared to the reported discovery and background information. Moreover, we can determine the pre-fire condition of the engine and transmission by analyzing the fluids. Fire debris for flammable liquids needs to be collected soon after the fire because it can evaporate. Therefore, it’s best to manage it within days because it increases the chances of getting an accurate test result.
It’s crucial to remember that fire suppression water will dilute and flush away the accelerant. As a result, it can destroy and throw evidence 50 to 100 feet away from a vehicle.
When investigating a fire, the origin must be determined through various means before thinking about possible causes.
Personal line case study 1

Figure 1: The vehicle’s dash area
The reported information was that smoke was discovered coming from the dash area. The driver exited the vehicle and called 911.
Working from the areas of least damage to those of most damage, we discovered some surface scorching to the dash. But there was much more damage below the area left of the passenger footwell.

Figure 2: A photo taken from the driver’s side footwell.
Figure 2 shows a similar amount of fire damage low in the dash. Again, this is similar to what was observed in figure 1.

Figure 3: An image of the passenger footwell.
During the examination, we saw melted plastic in the passenger footwell. The remains of the HVAC fan and its blades were also found in this area. The fan blades had fallen from their installation site. However, the dash above the area observed not much fire damage. None of the wiring harnesses or other components showed a high degree of fire damage.

Figure 4: After melted plastic was removed, the center lower area of the dash.
After the melted plastic was removed, the center lower portion of the dash was examined. Wads of napkins were discovered in the area of fire origin, and there was no evidence of an accidental ignition source. The insured could not explain why there were wads of napkins in an inaccessible area of the enclosed dash unless panels and carpeting were moved out of the way.
Personal line case study 2

Figure 5
The reported information was that the vehicle was driven when the owner noticed smoke escaping the passenger side dash. He pulled the truck over, called 911, opened the front passenger door, went around, and moved away from the vehicle.
The fire patterns observed in the examination did not support a fire starting inside the dash. Instead, it seemed like a fire had burned in the footwell or on the seat and attacked the dash. In addition, the components inside the dash cavity were in good condition. Therefore, if a fire started inside the dash, these items would be damaged and consumed before the fire even spread to other parts of the vehicle.

Figure 6: The excavated footwell
The footwell was excavated, and a large amount of packed and folded cardboard was discovered in the area, along with aerosol cans.

Figure 7: The cardboard layers discovered during excavation.
Permission was provided to remove the infotainment system, which was in excellent condition.

Figure 8: The infotainment module.
The download of this module showed that the vehicle had been pulled over at this location for about 16 minutes, with the car running and the doors opening and closing before the fire, causing the data to stop being recorded.

Figure 9: The report obtained from the infotainment system.
The driver had reported that he smelled, then saw smoke escaping the dash, pulled over, and called 911 at 1:38 pm. The bottom axis in the report shows the time and date, and the left axis shows the vehicle’s speed. There was no documented traveling of the car after 01:20 pm on the infotainment download.
The vehicle stopped moving at about 01:16 pm that day. The fire department report showed they were on the scene at 02:05 pm. The infotainment download showed that the vehicle was pulled over at 01:16 pm, and the truck didn’t move after that time. The only activity was doors opening and closing.
Commercial case study 1
A commercial vehicle was being driven when the driver reported some warning lights and smoke entering the cab from the dash area.

Figure 10: The engine compartment of the vehicle.
The reported information was that the vehicle’s owner was pulled over on the side of the road. When a passing tow truck pulled over, the driver jumped out, grabbed his fire extinguisher then quickly and efficiently extinguished the fire.
Upon arrival at the scene, we noted that the origin was small and located in the engine compartment beside or inside the fuse block.

Figure 11: The exterior of the fuse panel.
Some surface deformation and scorching to the exterior of the fuse panel were observed. However, this distortion to the material and the effects of heat were only present on the external surfaces. The areas adjacent to the affected location were utterly unaffected by the fire, indicating a very targeted application of flame on the surface.

Figure 12: The wiring harnesses in the fuse block, with insulation.
We examined and thoroughly documented the fuse block’s plastic body and the area’s wiring harnesses. First, we examined the wiring harnesses and began with the exterior protective cover (the loom). The loom protects the wiring harnesses located inside the fuse block. Next, the exterior and interior surfaces were examined after the removal of all sections of the loom. This allowed us to examine the wiring and insulation inside and on each of the conductors inside the harnesses.

Figure 13: The internal wiring.
Once all the charred material and loom were removed, there was no evidence that any of the wirings had failed. Inside each strand in figure 12 is copper wiring, where the current flows. In addition, each conductor has a sleeve of insulation. In this case, only surface charring of the loom and some minor heat damage to the insulation in some of the individual conductors were present. Therefore, we concluded that the only good ignition source for this fire was the direct application of flame.
Commercial case study 2

Figure 14: An image of the top surface of the hood.
A truck was parked in the operator’s driveway when he got alerted to the fire by a neighbor in the middle of the night. The truck hadn’t been driven in a few hours, eliminating the possibility of hot surface ignition as an accidental fire cause. The only other options were electrical or intentional ignition.
To determine the fire’s origin, we compared the fire damage and corrosion effects on the interior and exterior surfaces of the hood, the right fender, and the bulkhead at the base of the windshield. The top surface of the hood had orange corrosion occurring.

Figure 15: The underside of the hood.
The underside of the hood had minimal corrosion effects at the back-end edge, close to the base of the windshield. However, the underside did not show the extent of corrosion observed on the top surface of the hood. This indicated that the fire possibly originated on the vehicle’s exterior and not inside the engine compartment. This was the first clue that the fire may have been intentionally set.

Figure 16: The area of fire damage.
The fire damage in the right rear quadrant of the engine compartment had a considerable amount of electrical wiring that needed to be examined for evidence of electrical failures. An energized wire could provide proof of an arcing loss resulting from the fire spread. In this case, there were no electrical failures in the general area of fire damage.
The fire burned intensely on the vehicle’s exterior surfaces from an accelerant being poured. In contrast, there was less fire damage and loss of material inside the engine compartment.

Figure 17: The passenger fender.
The passenger fender showed the effects of an accelerant burning on the exterior surface. However, the side of the fender facing the tire and the engine compartment had less loss of material in comparison.
These case studies indicate that physical evidence is the most critical aspect of vehicle fire investigations. As a forensic expert, you don’t have to factor in the insured’s intent because it is outside the scope of your inquiry. However, legal experts must carefully determine the purpose where necessary.
The arson triangle
Typically, people steal vehicles to drive or tear them out for parts. So, a car with significant fire damage is a major cause for concern. Vehicle fires, as a result, always warrant an extensive investigation that considers these three points:
1. Proof of a deliberately set fire
2. Motive
3. Opportunity
We rely on forensic experts to show that there’s an incendiary fire. Motive, the second part of this triangle, is inevitably financial. The financial reason is often demonstrated in documents or other investigations. The third part of the arson triangle answers the question of who had the last or best chance to be on the fire scene. Cell phones and video surveillance have made it easier to determine when people were at the scene, which often turns out to be a vital part of the analysis.
Statutory condition 6 is your friend
Statutory condition 6 allows an insurer to submit an examination under oath. You can have you’re insured examined to produce reasonable evidence. Using this statutory condition, an insurer can obtain financial or maintenance records, amongst others. Obtaining bank records or a credit card history of the insured, for example, could help determine the motive. Vehicle records could also help determine the reason for arson.
Case study

Figure 18: The burnt vehicle.
The insured reported a vehicle stolen from the driveway during the night and was found burned the next day. The fact that the car was found burned was a cause for suspicion. In this case, investigators determined that an accelerant was used to start the fire in the vehicle’s backseat. This determination met the first requirement of the arson triangle – confirmation of an incendiary fire.
Statutory condition 6 was used to get an undertaking to obtain maintenance and bank records. The maintenance records showed that the vehicle was in the shop every other month for fairly serious repairs, and the insurance still owed money on the purchase. In addition, the vehicle needed a new transmission at the time of the incident, and the estimated cost was approximately $4,000. So, a significant payment was on the horizon if the owner wanted to keep the vehicle.
The bank records showed that the insured was in a financially precarious position. He was overdrawn on his bank account and had credit card debt. So, there was a financial motive as well.
The vehicle was in the insured’s driveway, and the owner had the only set of keys at the time. When looking at a vehicle fire, you always want to start with the keys for the opportunity element – who had the keys or access to the keys?
All the elements of fraud were present in this case, and the claim was denied. However, the insured continued with the claim. Our experts continued their investigation because it appeared that the case could go to court. In addition, the investigators spoke with the ex-girlfriend of the insured, and she knew of the entire plot to burn the vehicle. She gave us a signed statement where she detailed what occurred.
The insured returned with his ex a few months later and tried to resurrect the claim, but we already had the signed statement.
This example underscores the importance of detective work. You must ensure that you’re turning over every rock during the investigation and doing so fairly and comprehensively. People who commit these crimes also tend to talk to their loved ones. And so, interviewing the right person is a big help. Social media dramatically assists you; you can find the insured’s close friends.
Key takeaways
- Leave no stone unturned and ensure you’re doing it in good faith. Every investigation should be comprehensive.
- Social media is a massive tool for your investigation. A complete social media search could considerably benefit your case.
- Consult the arson triangle in potentially fraudulent claims.
Contact Origin and Cause for Vehicle Fraud Investigation Today!
The cause of a mechanical loss can be as simple as a piece of equipment or a more complex system. In other cases, a mechanical loss could be due to an entire assembly line. For example, we often encounter complex mechanical claims if an item has moving parts. In such cases, the object would have different components that could be utilized to move those parts smoothly and without friction. Instead, however, those parts can fail.
Mechanical systems are sometimes intertwined with electrical systems, which would make these systems electrically energized. Mechanical claims are not only based on cars, but vehicle claims are amongst the most common. Vehicles have intricate and detailed designs, making their claims more complex.
The first step of every fire investigation is determining the area of origin. Without this step, it is impossible to investigate the cause of a fire. When determining the area of origin, we consider fuel loads, wind speed, and wind direction (if the loss occurred outside).
It is also essential to collect background information, discovery, and service history. Technological advancements have made the information-gathering process much more manageable. We now have computer systems that provide some of this information. For example, we can find wiring and routing diagrams of different vehicle wiring harnesses without going to the dealer.
In-vehicle fires, a flammable liquid that has escaped from its position can form a vapor cloud, which a hot surface can ignite. In addition, there are hot surfaces in the engine compartment that run from the front to the rear of the vehicle, meaning there are several opportunities for ignition.
A complex mechanical claim always starts with a preliminary investigation. This involves a site visit to determine the extent of the damage, the level of complexity, parties involved, and specialists you may need to retain. A preliminary examination allows one to examine and preserve the physical evidence and determine if it needs to be moved. However, it is highly unethical to conduct an on-site examination without all the involved parties present.
Gathering background information
Mechanical systems are often three-dimensional, making it challenging to document all physical evidence at the beginning of the investigation. Therefore, one of the first analysis steps is to request information from the client and gather witness statements. This makes it easier to collect discovery information at the earlier stages. In addition, fire department and police reports are often precious sources of information.
It’s also crucial to request documentation for recent service work on the vehicle or equipment. For example, determining if the car was stationary or moving at the time of failure could indicate potential failure modes. It is equally crucial to get information on the vehicle’s performance before the fire. A recent service report involving the electrical system further allows investigators to identify parties to examine the scene or evidence.
Always ask for the Vehicle Identification Number (VIN) to access recalls and published recalls through Transport Canada or NHTSA. You can also use Mitchell1 and AllData to access technical service or technical support bulletins. Additionally, an investigator must request a CarFax to access the vehicle’s accident history and servicing information. This could help determine the area of origin of the fire.
Potential ignition sources
- Electrical failures
- Leaking fluid ignited by sparks or hot surfaces
- Mechanical failure
- Open flame
Case study 1: Personal vehicle
A Dodge Ram EcoDiesel was recalled after discovering that the Exhaust Gas Recirculation (EGR) cooler suffered leaks from thermal fatigue. The cooler expands when heated and contracts as it cools down. At times, the thermal expansion of EGR coolers creates tiny cracks. However, EGR cooler fires only occur when the vehicle is in operation.

Figure 1: The vehicle that caught fire
The owner was driving the vehicle at approximately 100km/h when he heard a loud pop from the engine. When he pulled over, he saw nothing wrong. However, when the vehicle owner continued driving, he experienced a loss of power. Shortly after, he was alerted to the fire by someone in a nearby vehicle. It is impossible to see where fire ignites when looking at the engine because it occurs inside the intake manifold.
The engine compartment and the hood sustained minimal fire damage, and the hood was flipped up onto the windshield. The engine compartment had a distinct fire pattern underneath the intake manifold, which indicated that the fire originated inside this intake manifold.

Figure 2: The inside of the engine compartment (left) and the underside of the hood (right).
During a preliminary examination of such vehicles, one must document the systems to determine the cause of the fire. Then, the vehicle manufacturer and the dealer must be invited for the examination. Removing the EGR system, followed by a pressure test, is the only way to determine whether there is a failure or leak in the EGR cooler. In such cases, a destructive examination is necessary. This refers to the altering of evidence for an extensive investigation. During the joint destructive examination, we removed the entire EGR system.

Figure 3: The car’s EGR system.
The car exhaust flows through the EGR cooler with two downward-facing side ports. These ports are the inlet and outlet of the coolant. The EGR cooler takes coolant from the engine coolant system and routes it through the heat exchanger. So, the exhaust and coolant run through the EGR cooler, but separately.
During the failure of an EGR cooler, thermal fatigue causes the coolant to leak out of its controlled system into the exhaust flow, which then goes directly into the intake manifold. Usually, an EGR system blends some exhaust gas into the intake with fresh air to keep it within the target emission level.

Figure 4: A schematic of the EGR system.
Thermal fatigue cracks can occur in the heat exchanger, allowing coolant to enter the intake manifold. The EGR Transport Canada Recall states that “thermal fatigue may cause the cooler to crack internally over time. An EGR cooler with an internal crack will introduce pre-heated vaporized coolant to the EGR system while the engine is running. In certain circumstances, this mixture interacts with other hydrocarbons and air in the system, potentially resulting in combustion within the intake manifold. It can lead to a vehicle fire.”

Figure 5: Two hoses connected to pressurize the coolant running through the EGR cooler.
As indicated in figure 5, there is a pressure gauge at the end of one hose. Under the testing conditions determined by the manufacturers, we used a bicycle pump to get the pressure in the system to 20 psi. We then submerged the cooler into a pail of water. Submerging the cooler in water results in a stream of tiny bubbles if there is a leak. A more significant leak will result in much larger bubbles. Tiny bubbles were observed.
The manufacturer had a long delay in engineering and manufacturing the replacement parts for this EGR recall. You can acquire an EGR delete kit online and through parts suppliers. However, it is not an OEM option, so the vehicle manufacturer does not support an EGR delete kit. It removes the car system, increases the power in the vehicle, and increases emissions. If improperly installed or completed, it could even be a possible failure mode.
We discovered that an EGR delete was partially completed, and the exhaust was not completely connected. The vehicle owner drove with the exhaust coming out of the manifolds. He essentially had no exhaust system from that point towards the rear.
Critical takeaways for auto adjusters
- Do not quickly payout vehicle fires without investigating the cause. Uninvestigated fires can leave future investigators with unanswered questions.
- Retain an expert before you payout because the insured may not be motivated to answer subsequent questions when they’ve been paid. It could lead to incomplete information, which would make it impossible to investigate the claim any further and even affect future subrogation.
Case study 2: Wheel-end fire

Figure 6: The truck that experienced a wheel end fire.
Wheel-end fires are common in mechanical claims. There are three different scenarios when a wheel-end catches fire. First, a truck typically has two wheels on one side on the same axle and two wheels on the other side. If one of those tires loses pressure while the trailer is being pulled down the road, it can create friction and result in a tire fire with nothing wrong with the brakes or the wheel bearing. In such cases, the tire itself can burst into flames.

Figure 7: A functioning wheel bearing (left) and a bearing indicating failure (right).
Wheel-end fires could also be caused by a failure in the brakes and bearings. However, if the cause of a wheel end fire is not the brakes or bearings, we can hypothesize it is a tire fire. In this case, the truck was pulling the trailer at the time of the fire. The driver saw smoke coming from the trailer. When he pulled over and got to the rear of the trailer, one wheel-end was burning.
Preliminary examinations of wheel-end fires often have limitations. You cannot remove the wheel-ends without the other involved parties present. During an initial examination, we can do things to help eliminate the brakes or bearings. However, a complete investigation is only possible after removing the wheel ends and in the presence of all involved parties.
In the functioning wheel bearing in figure 7, all the roller bearings are spaced perfectly around the perimeter. The other bearing shows two different sets of rollers. On the right-hand side, the roller bearings look damaged. They have essentially been smeared due to elevated temperatures. The cracking and gouge marks on the right-hand side in figure 8 indicate a brake drag resulting in excess heat.

Figure 8: Fire-damaged brake pads with no cracking or excess heat damage (left) and brake pads with visible cracking and gouge marks (right).
The brakes automatically engage if you lose air pressure to a vehicle system such as a tractor-trailer system. The air pressure pulls the brake pads away from the inside of the drum. It is a noticeable change to the vehicle driver because a brake system failure results in a significant drag. The scoring and cracking inside the brake drum in figure 9 indicates a brake drag that resulted in extremely high temperatures. The friction from the brake drag subsequently causes fire.

Figure 9: Fire-damaged brake drum with no cracking or excess heat (left) and the inside of the brake drum with visible scoring and cracking (right).
Even in a wheel-end fire, a service record is necessary before an investigation can be concluded. Investigators also need to know when a wheel bearing was last changed, previous problems with tire pressures, and the mileage on the trailer.

Figure 10: A diagram showing a brake pad system.
As indicated in figure 10, the slack adjuster and push rod normally form a 90-degree angle. A typical preliminary examination includes measuring this angle to ensure that it is correctly oriented. This angle is measured at all the wheel-ends and in every axle. The measurement shows us if one wheel-end is significantly different from the others.
The slack adjuster will automatically adjust to keep even brake applications as pads wear, but they need to be appropriately set when they’re installed or when the wheels are removed. A brake system failure could also result from a manufacturing defect or improper servicing.

Figure 11: Images showing the measurement of the slack adjuster angle and the pushrod length.
We discovered that during the manufacturing process, there was a bracket. We determined that the bracket was installed upside down to secure the slack adjuster in position. Since it did not retain the slack adjuster, it did not operate properly. In this case, all the brackets in the trailer were installed incorrectly.

Figure 12: Images showing the improperly installed bracket.
Case study 3: Agricultural
A combine suffered a fire while it was operating. Smoke and then a fire was observed by the operator on the right-hand side of the combine. The operator shut the combine down but was unable to extinguish the fire. There was a tremendous amount of fire damage on one side of the combine (figure 13), and there were no reported operating issues leading up to the loss.

Figure 13: The fire-damaged combine.
Multiple ignition sources surrounded the combine. The fire was first spotted on the damaged side of the combine, near the elevator.

Figure 14: A close-up of the combine elevator.
The bearing for the straw chopper was identified as having a failure. A bearing failure can never result from the fire because the temperatures reached during a fire are not high enough to smear hardened steel. When we noticed that the alignment of the bearing was off, we requested a service history of the equipment.
In the absence of a service record, we would have to look at the recommended maintenance by the manufacturer to see if and how it was supposed to be serviced. We discovered that no servicing was required for the equipment.

Figure 15: A disassembled bearing for further analysis.
To get a clearer view of the areas of interest, we removed any obstructing items from the equipment. It allowed us to see that what remained of the bearing was smeared metal.
Some bearings are self-lubricated, while others need to be greased every 30 hours. Some equipment has an onboard fire suppression system, including a tank of suppressing agents piped to nozzles throughout the machine. Most often, this would be the engine compartment. Sometimes it will be where the hydraulics are, but that is rare.
The nozzles are always open so that if the suppression system is activated, the agent will be forced out of every nozzle. There are two methods of activation – manual and automated. Sometimes, there are temperature sensors in the engine compartment, and a manual activation sometimes is required. The switch for manual activation is usually in the cab.
Due to its several systems and parts, a combine loss can become an extremely complex fire investigation.

Figure 16: An example of the parts and systems of the combine.

Figure 17: A close-up of figure 16 indicates the part that failed with a red oval.
Figure 17 shows the bearing components for one beater bar. Part of the combine has a separator, and the separator hours are tracked on a combine. The total hours these components would be running are then documented. As such, we needed to examine the hours and greasing procedure compared to the manufacturer’s recommendations. We also had to consider the grease amount and the type of grease used.
Using the wrong grease might impact whether a bearing can withstand its expected lifespan and load conditions or if it would fail prematurely. Sometimes we must analyze the bearing side versus the load.
Case study 4: Mechanical damage

Figure 18: The safe
Nine years ago, we were retained to investigate and assess an alarm system after an alleged break-and-enter at home in Toronto. During an alarm system assessment, we discovered that the safe had been broken into. Over $100,000 worth of items were stolen from the safe. As such, the safe was examined.

Figure 19: The locking mechanism on the safe.
The safe was in the locked position while the family was gone, and no one that remained in Canada had the combination to the safe. However, no deformation was observed on the throw of the safe. The secure door was removed, and the safe body remained intact within the wall. The safe installation was between two wall joists. The safe was therefore removed for further examination.

Figure 20: The safe after removal from the wall.
As shown in figure 20, the upper holes on the safe body indicate that the split pin from the hinge assembly on the door sustained minimal damage. The bracket in the bottom image is where the throw from the locking mechanism would have come against, and it had minimal scraping damage, but there was no total deformation. The flange was located approximately an inch from the edge of the safe, and the door rested against it when closed. The door was recessed about an inch inside the safe body.

Figure 21: The front of the safe door.
Figure 21 shows the deformation on the hinge assembly, which indicated that it was pried away from the door at the top and bottom. The limited deformation on the body of the safe did not match the extensive deformation on the hinge assembly. Therefore, it made no sense for the safe to have been pried with the door closed.

Figure 22: A close-up of the hinge assembly showing scratches.
There was significant deformation to the edge and surface of the hinge assembly. This indicated that a pry bar was placed between those two parts to open the safe. However, the damage only lined up with the doors in an open position.
We concluded that this was an attempt by a colleague of the insured to pry the safe door. They tried to pry it open when it was closed, but they could not break into the safe. So, they opened the safe door using the combination and then pried the door off while in the open position to make it look like the safe had been broken into.
Key Takeaway:
- We must go through the entire investigation before concluding; we cannot skip straight to the end.
Partner Up with OCI Group to Uncover Mechanical Loss Claims
Claims involving mechanical losses might be difficult to decipher and grasp. OCI Group’s team is well-equipped and knowledgeable in the field of complex claims, as well as how to perform an investigation to determine the root cause of a failure. We provide concrete responses based on facts, and all conclusions are reached only after the facts have been verified. To assist you with your claim, call OCI Group at 1-888-624-3473 today.
There is no exact definition for complex claims because they come in different forms. They usually involve multiple stakeholders, but not always the same ones. The only constant with complex claims is unpredictability, which makes them challenging. Complex electrical claims are no different.
There are inherent technical complications with electrical failures. Sometimes, the signs of failure can manifest at a distance from the root cause. Other times, the removal of power leads to physical changes in the scene. It makes it difficult or even impossible to distinguish electrical causes from the effect of a fire. These factors contribute to the complexity of electrical claims.
Electrical claims can also be subject to legal, logistical, safety, and other complications that are not necessarily present in different types of losses.
Case study 1: Electrical injury
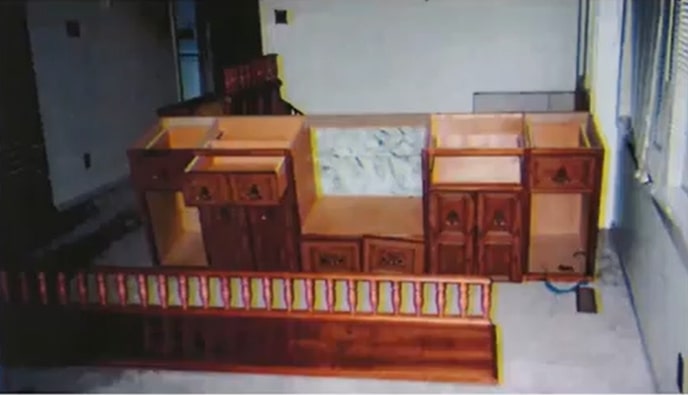
Figure 1: The cabinet that hid the unconnected end of the cord.
A toddler got injured in a rented house she was living in with her family. A double plugged extension cord was connected underneath a built-in cabinet. The unconnected end was hidden under the cabinet. During a game of hide-and-seek, the child hid in the area. She grabbed the energized end of the cord and got injured as a result. The toddler suffered severe injuries to her mouth, face, and one finger. These injuries involved permanent scarring and damage to her face and mouth, limiting movement and facial expressions.
Through a litigation guardian, the toddler sued the landlord, property manager, former owners of the house, and other parties.

Figure 2: A model of the cabinet showing the electrical installation.
Initial observations
We were retained later than the incident. As such, we only received a few photos of the scene. We, therefore, generated the model in figure 2 based on information we received. It was determined, during the trial, that tenants likely modified the cabinet after the landlords purchased the house.
There was an electrical outlet box mounted underneath the cabinet with power supplied from under the floor, near the center of the cabinet. A double plugged cord ran from that outlet through the bottom cavity of the unit to the other end. There were also two duplex outlets mounted to the cabinet in a rough install. These were seemingly intended to power stereo equipment.
The way this was built meant there was no legitimate way to power them, except with a double plugged cord. However, if you plug energized cords into one outlet on a duplex receptacle, the other outlet will become energized, allowing you to use that one normally.
Technical issues that were addressed during the investigation:
The client requested that we investigate possible violations of the Canadian Electrical Code, such as:
- Cable supports – Power cables need to be stapled to a joist or a stud at a specific distance to provide support.
- Concealed junction boxes – The junction box was concealed beneath the cabinet and was therefore not visible for maintenance.
- Use of flexible cords – We found improper use of a flexible cord.
We had to determine if these code violations constituted a hazard. The flexible cord issue was the biggest one, but the concealed junction box also meant that a casual observer would not know there was power beneath the cabinets. According to the Canadian Electrical Code, no flexible cord may have exposed energized elements if one end is connected to power.
Preliminary findings and analysis
We had to determine whether the actual injuries matched what would be expected in theory. After some calculations, we found that the injuries matched the theoretical expectations. We also found that the current involved would be high enough to cause significant damage to tissues but not high enough to trip the circuit breaker. This allowed the current to continue flowing despite this incident.
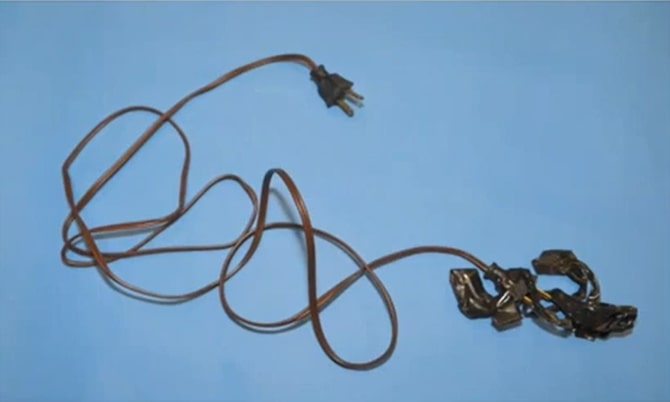
Figure 3: A picture of the cord that was involved.
As shown in figure 3, the cord had two plugins, one with tape on it. However, the cable was made from a lamp cord, and it was homemade. We also found blistering on the non-taped end that could have occurred during the incident.
A few non-technical issues became significant during the trial. The individual who created this hazard could not be identified, and there weren’t sufficient records of every previous tenant of the place. It was also challenging to identify the people who knew of the hazard. The owners had never set foot in the house because they were offshore property owners. The property manager also testified that she was not aware of the hazard.
We needed to determine whose responsibility it was to know of and correct this hazard. The court determined that the property manager’s inspections should have been more rigorous and that she should have looked deeply enough to find something odd.
The court determined that the rough installation would be visible, meaning the property manager should have seen it during her maintenance checks. During the trial, it was found that the main hazard was created after the owner purchased the house. However, it was impossible to determine precisely who created it.
The court found the two property owners and the property manager equally liable. However, they determined that the property manager should have conducted a more thorough review of the property between tenants.
Case study 2: Elementary school HVAC failure
An elementary school’s distributed heating, ventilation, and air conditioning (HVAC) system failed, leading to heat and fire damage. In addition, we discovered an unusual HVAC system in the building. There was an independent heating and cooling unit in each of the 13 classrooms. Heat and fire damage was identified in 12 of the 13 ventilation units.
The school was affected by a widespread power outage the previous weekend, and the smoke and fire damage was discovered the following Monday. Direct fire damage was only found inside the HVAC units in the classrooms. There was no direct structural fire damage, but smoke damage affected every part of the school.
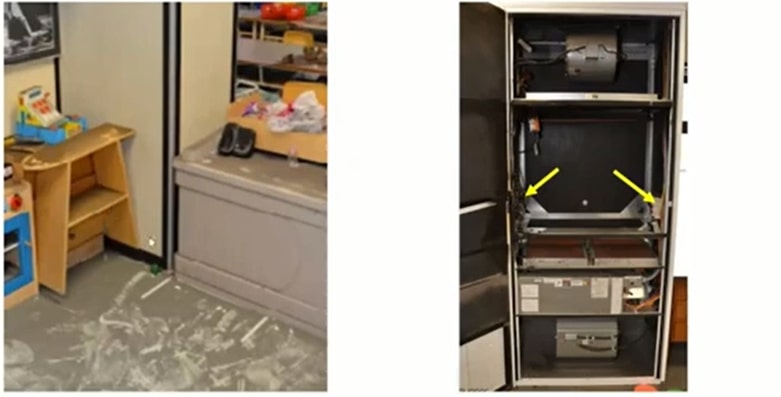
Figure 4: A picture showing that smoke settled on every available surface in the building (left) and another showing direct fire damage to the ventilation units (right).
All student property had to be cleaned or replaced. It included all the school’s fixtures, fittings, and contents, including library books, textbooks, bulletin boards, gym equipment, computers, and AV equipment. As such, this became a large claim with several small stakeholders.
The arrows on the right-hand side image in figure 4 point at the Variable Frequency Drives (VFDs). Each of the ventilation units had two of them.
Preliminary findings and analysis
We discovered that 18 of the 26 VFDs were damaged, and two of the eight undamaged units were in the undamaged classroom.
VFDs control the speed of Alternating Current (AC) electric motors. Due to inherent technical limitations, AC electric motors are usually used for only single-speed purposes. A VFD takes incoming power and changes the wave’s frequency, which subsequently adjusts the speed of the motor. Unfortunately, VFDs are pretty sensitive to poor power quality, especially in three-phase power for large applications (shown in figure 5). If they’re exposed to unmatched power phases, they can react badly.
The VFDs in this school were not defective; they were exposed to input power that they could not handle. Power records indicated that one phase ultimately failed during the outage, while the other two remained on. VFDs can be damaged if one phase drops to about 80% or below relative to the others—power on the phases that remained dipped by up to 75% of nominal voltage. The fuses protecting these VFDs were the slow blow type.
No other equipment had damage, and the power conditions would be expected to lead to failure, heating, and potentially fire in VFDs.

Figure 5: An undamaged unit, one with patterns indicating heat from the inside (left), a partly damaged unit (middle), and one that heated to ignition (right).
This power outage came and went with large fluctuations in power. Therefore, ordinary fast-blow fuses might have protected the VFDs. However, it is standard practice to put slow blow fuses on circuits for motors because they have high startup currents. These startup currents do not typically endanger the supply wiring, even though they exceed the nominal levels for which it is designed. However, they can expose equipment like VFDs to more considerable input variations than they can handle.
Claim complications
· Sheer quantum of the loss – The loss affected a significant part.
· One major party in this claim was the school district, which was self-insured.
· Hundreds of minor parties – Several other parties (students and staff) experienced a slight loss.
· School subrogation opportunities for the loss – The two major parties for the claim (the school district and power utilities) were owned or controlled by the province, which likely reduced the appetite for pursuing subrogation. There were considerations of going after the designer of the HVAC units, but the school and the HVAC system were quite old. Since then, all the maintenance work was done by school district staff, including fuse replacements. In the end, the district had to accept the loss.
Case study 3: Electric vehicle fire in an underground mine
Electric vehicles are attractive to mine operators because they produce no emissions to be ventilated out of the mine. Additionally, they don’t require fuel. This incident notwithstanding, electric vehicles are an excellent solution for that application. A fire involving an electric vehicle, while far from desirable, is less hazardous than one involving a gas or diesel-driven vehicle.
A fire occurred in an electric vehicle inside a mine drift. This vehicle was based on a commercially available chassis and a modified body. The car was parked and not charging at the time of the fire. However, it had experienced some charging issues and caused a ground fault in the weeks leading up to the fire incident. The fire was extinguished and then cooled with briny water.
The fire affected a section of electrical wiring strung on the ceiling of the mine drift, resulting in a brief loss of power for a part of the mine.
Preliminary findings and analysis

Figure 6: A picture of the vehicle after the fire.
Observed damage increased towards the engine compartment, which has the electric motor, one of two battery banks, the charger, and a lot of control circuitry. In addition, there was increased oxidation in front of the vehicle. However, the rear tires were intact, and there was some protection to combustibles in the passenger compartment. Those observations led us to look inside the engine compartment for causation (figure 7).
The battery pack was underneath the fast charger. Therefore, most of the major components had damage indicative of exposure to fire. However, we did not identify any significant electrical damage.
When working with vehicles, we often pay a lot of attention to patterns involving the oxidation of metals. In this case, we had to be cautious with those patterns because the fire suppression was done with briny water, which accelerates and exacerbates the oxidation of the metals. It does not make those patterns misleading, but they don’t always mean what they would on a typical fire.

Figure 7: The engine compartment.
The vehicle had modular battery packs, and we found more significant damage on the left module than on the right. Most of the battery cells were intact; only a few were ruptured. These battery packs usually consist of small cells like those found in laptops and other smaller electronics. During an examination of these cells, we looked for differences in levels of damage and eliminated other potential causes for that damage. 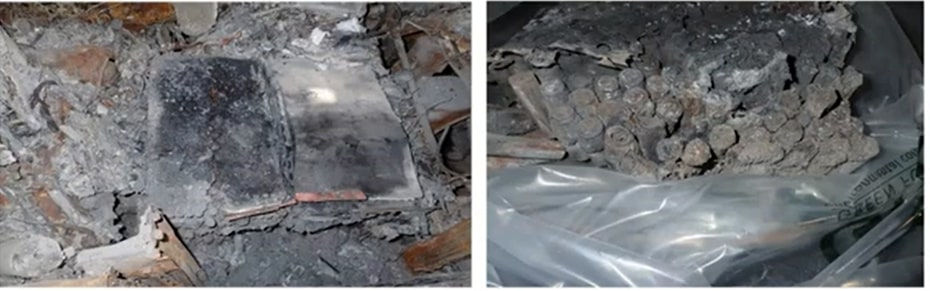
Figure 8: The damaged battery packs.
Some cell differences can be due to factors external to the battery pack, like fuel load concentrations or exposure to a fire. If those external factors can’t explain the signs, the failure is likely internal to the battery pack. A single cell failure often creates excessive heat, leading to thermal runaway in adjacent cells. We concluded that a thermal runaway occurred in one of the battery cells then spread to others. In addition, we found a localized cavity or damaged battery cells within the battery pack.
Thermal runaway is a feedback loop effect when one cell has a small failure that generates excessive heat. It leads to an increase in the battery chemical rate because batteries run faster when they get hot. That increase in temperature leads to a higher electrical current, which leads to more heat. The effect can start in a single cell and spread to nearby cells.
Safety and logistical challenges
We faced several site-specific challenges during the investigation. There were special precautions and regulatory requirements for an underground location. However, we received in-depth orientation from the mine staff—the other complications involved battery pack handling. We needed to consider that some cells could still be sufficiently intact to carry a charge. So, we used thermal monitoring throughout the investigation to look for hotspots. We also had fire suppression on standby.
Before discarding the battery packs, we considered that some of them could still be energized. As such, each module of the battery pack had to be separately packed in plastic bags, which were placed in barrels along with a non-combustible packing medium. The barrels were sealed for safe removal from the mine.
Fundamental principles of adjusting complex electrical losses
Investigators and adjusters working with complex claims often have specific ways of thinking. However, it is a crucial aspect of all complex losses. When dealing with complex claims, you must be prepared for the unexpected because delays in the repair process are inevitable.
As an adjuster, you need to investigate all potential contributing factors to the cause of loss. For example, it could help determine if other policies contributed to the claim. Moreover, it’s crucial to always think outside the box. Loss scenarios may be similar, and you may have similar pieces of equipment, but the insurance and outside elements can vary significantly.
Essential factors when investigating complex electrical losses
- Determining the root cause of loss and what perils may have contributed to the event – In most complex electrical claims, we engage an electrical engineer to determine the cause of the loss and the scope of repair to the piece(s) of equipment.
- Mitigating damages, especially when there is lost revenue and extra expenses – Many electrical failures have a resulting power outage, leading to lost revenue for the insured or additional costs incurred to restore temporary power to the building.
- Confirming what coverage is available and which policies could respond – Depending on the cause of the loss or the contributing factors, more than one policy could respond to a claim. Except for minor claims, it’s essential to evaluate the coverages available under all the policies enforced.
Types of policies that respond to electrical losses
- Equipment Breakdown (EBI) policy – Covers the sudden and accidental failure of equipment, such as a power surge or short in the system. Claims must meet the definition of “accident to an object” to trigger coverage. An accident, in this context, refers to the sudden and accidental failure of equipment. Generally, if there is no external interference contributing to the failure, it would be considered a pure EBI loss.
- Property policy – Covers all risks of physical loss or damage. These policies exclude damage caused by electrical disturbances to electrical equipment. This common exclusion means a property policy does not respond to internal equipment failure. However, suppose external interference caused damage or loss to electrical equipment. In that case, coverage could be restored under the property policy and possibly under the Equipment Breakdown, at which time you might have a joint loss.
- Combined or a hybrid policy – A combination of property and EBI policies.
Case study 1: Backup generator failure at a hospital
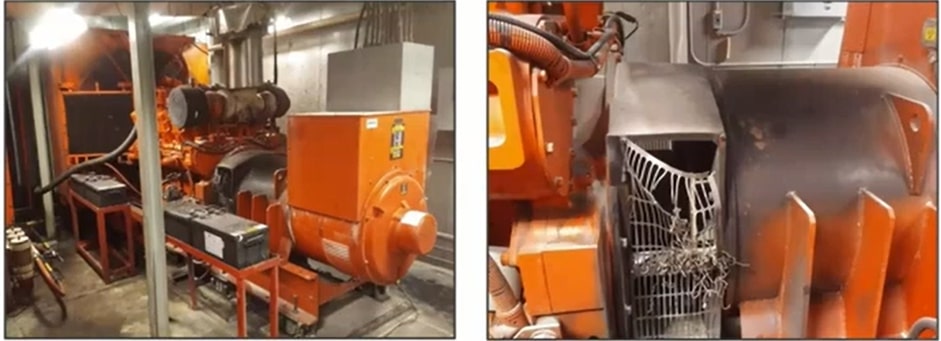
Figure 9: The backup generator (left) and the damaged alternator portion (right).
A unit of the backup generator failed during a routine weekly test by the insured. Damage occurred to the alternator portion of the generator, which includes the mechanical section. These units provide power in a power outage within the hospital.
The insured rented a temporary backup generator while this unit was down. It cost them nearly $20,000 per month. Since this unit had a mechanical portion and an electrical portion, i.e., the engine and alternator, we retained a mechanical and an electrical engineer to determine the cause of loss and scope of repair.
It was determined that the cause was an electrical failure within the alternator side. There was no outside interference, and thus, we had a pure EBI loss.

Figure 10: The generator’s alternator (left) and turbo (right).
Figure 10 shows the electrical and mechanical damages sustained by the generator. The engineers prepared a scope of repair, and we contacted a few contractors to provide repair quotes. We then presented a settlement offer to the insured. The repairs should have been completed within six months of the date of loss, which would have made the maximum exposure for the rental generator $120,000.
Unfortunately, due to unforeseen delays and issues at the hospital, the repair took closer to 20 months, and the extra expense claim increased to approximately $400,000. The lawsuit was settled between $120,000 and $400,000 because the hospital caused the delays, not the insurance company.
Case study 2: Transformer failure at a condo

Figure 11: A closer view of the damage to the high voltage coil and the grounding cable of the transformer.
Failure of a transformer resulted in a power outage to an entire 40-story condominium building. The condo corporation rented a generator to restore temporary power. However, the generator had to operate full time to provide power to the building. In addition, it cost $14,000 per day for rental and diesel fuel.
An electrical engineer was retained to determine the cause. The cause was a surge from the hydro supplier’s equipment, meaning there was no outside interference. As with the first case study, this was a pure EBI loss.
The electrical engineer also determined that a temporary repair could be completed on the transformer, meaning the building could restore power. At the same time, the condominium owners awaited a new transformer. This would eliminate the extensive rental generator and fuel costs.
The engineer overlooked hidden damages to the transformer, which were uncovered by the contractors who went to do the temporary repair. As such, the insured were forced to continue using the rental generator. To reduce this cost, we sourced and installed a temporary transformer at a minimal one-time charge of $6,000. At this point, the insurance had exceeded their extra expense coverage for the rental generator costs.
Case study 3: Hydroelectric plant turbine failure
A two-turbine hydroelectric plant was generating approximately 11.5 megawatts of power per unit. Figure 12 depicts the internal equipment of the plant, which uses the river’s flow to create mechanical energy. The water would flow from the turbine shaft beneath the concrete to generate mechanical energy, which went into the alternator portion. The alternator portion then generated electricity that ran into the grid.

Figure 12: Internal equipment of the hydroelectric plant
The plant had a G1 and a G2 turbine unit. The loss occurred during the low river flow season, and only the G2 unit was operating.
When the G2 turbine shaft failed, the insured activated the G1 shaft to reduce any potential lost production. However, the autumn high river flow was only a few weeks away, meaning both turbines would be required to maximize output. Unfortunately, it was impossible to conduct the repairs quickly enough to avoid that loss of revenue, which was approximately $15,000 per day during the high flow season.
It was a combined policy for property and Equipment Breakdown. We retained a mechanical engineer in this case because the damage was to the mechanical area of the plant.

Figure 13: Clearer images of the turbine (left) and shaft (right)
The mechanical engineer determined the cause to be a design failure within the shaft. The unit was approximately ten years old, and figure 14 shows the fracture area within the shaft.

Figure 14: The fracture area in the turbine shaft.
The fracture crack pictured indicates a poor design of the turbine shaft, meaning the G1 shaft likely had the same design issue. Therefore, we recommended that the insured replace both shafts to prevent a failure in the G1 unit. The insurer obtained quotes from various fabricators throughout North America based on a new design.
Two of the lower-cost fabricators came from Quebec and Chicago. To prevent delays, we recommended that the insured order shafts from both fabricators simultaneously. As a result, the shafts were installed promptly, and the insured removed the old G1 unit from production before springtime. In this case, we were able to minimize the lost revenue claim.
Case study 4: Switchgear failure

Figure 15: The cabinetry for the switch
This incident occurred at a hospital and involved a minor explosion within the automatic transfer switch. There was damage inside the button, as indicated in figure 15. All the internal components were destroyed and required replacement. Power is switched over to the backup generator in an outage at the hospital. As such, the insured had to rent a temporary generator for approximately $17,000 per month. There were no fuel costs as this was only for standby purposes. We retained an electrical engineer who determined that there was a leak through the ceiling in the room.
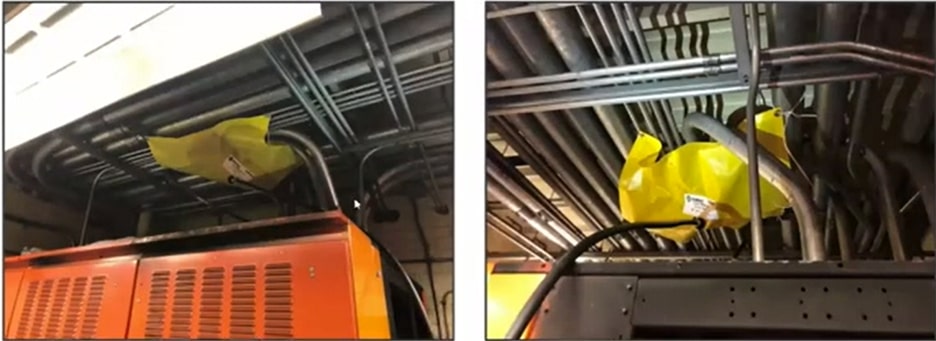
Figure 16: The ceiling area above the equipment.
Therefore, this case had outside interference towards the loss event and was reported to the property carrier. The property carrier confirmed that coverage would be afforded under their policy, just as the EBI policy did. Thus, we had a hybrid policy.
Based on the scope of repair provided by the electrical engineer, we contacted several contractors for repair estimates and made a settlement offer to the insured. In addition, based on the recommended timeline of repairs, we indicated to the insured that we would not cover the rental generator for longer than six months. Therefore, we could mitigate the extra expense exposure for the client or the insurer.
We allocated roughly 50% of the property damage and extra expense costs to the property carrier, significantly reducing our exposure.
Contact OCI Group for Complex Electricity Claims
We’ve explored the many aspects of Complex Claims and failure analysis throughout this article. There are a variety of reasons for electric failure, and our professional forensic team at OCI Group is well-versed in this area to provide an unbiased assessment of the claim. Please contact us if you require assistance with complex claims or failures that require specialized knowledge. Through a thorough scientific grasp of the issue, our team will get to the bottom of the problem.
Energy is universally defined as the ability to do work. Today’s world is made possible because humans have learned how to change energy from one form to another. The four types of energy are heat, electrical, chemical, and gravitational.
The primary energy uses – residential, transportation, electric power, commercial, and industrial – are often related or intertwined. For example, electrical power is essential to residential, transportation, commercial, and industrial needs.
Primary energy sources in the United States of America (U.S.)
- Petroleum – The global exploration, extraction, refining, transporting, and marketing of petroleum products.
- Natural gas– Uses similar extraction methods to petroleum, but the product is natural gas.
- Renewable energy – Useful energy collected from renewable resources that are naturally replenished.
- Coal – A combustible black sedimentary rock used to power a large percentage of the world’s infrastructure. Coal is widely used but very carbon-intensive.
- Nuclear power – Uses nuclear reactions to produce electricity. The energy is obtained from nuclear fission and nuclear decay. It has zero carbon emissions.
U.S. petroleum products consumed in 2020

Figure 1: An overview of the consumption of crude products in the U.S.
As shown in figure 1, 60% of all refined petroleum in the U.S. is used for road transportation. Using more renewable energy sources could significantly lower the country’s petroleum consumption and, subsequently, carbon emissions.
The cracked spread is the overall pricing difference between a barrel of crude oil and refined petroleum products. The constituent components of crude oil differ according to their source. Therefore, the source of crude oil will affect its crack spread.
The U.S. total energy consumption timeline (1950-2020)

Figure 2: A 70-year timeline of U.S. energy consumption.
As a society, we have become more efficient over the decades. We’re using our resources more knowledgeably and developing more renewable resources. Unfortunately, this shift means reducing older, less efficient energy assets. This peak energy curve shows the visible impacts as we get better at consumption and more efficient in our energy usage.
The oil and gas industry

Figure 3: Sectors in the oil and gas industry.
The oil and gas industry consists of upstream, midstream, downstream, distribution, and integrated oil companies. The upstream sector involves offshore, near-shore, and onshore production assets. On the other hand, the midstream sector consists of the storage, processing, and transport of produced energy, oil, or gas. These companies are primarily industrial. Their gas pipelines are usually several decades old, making them prone to failures. Most midstream assets around North America are at, or past, their initial design life.
Once oil and gas are extracted, they are transported to a refinery to process valuable fuels and chemicals. It makes transportation a crucial part of the oil and gas industry.
The downstream segment involves the refining of raw materials. As such, it usually consists of chemical producers and energy suppliers.

Figure 4: The separation of crude oil into different components.
While these components can be found in different barrels of crude oil, they often come in very different degrees. In addition, each type of crude oil poses a unique set of transport challenges. It means refineries must balance the different types of crude oil to maximize their output and capacity. Finally, distribution involves getting the final product to the residential, commercial, or industrial market.
Integrated companies own different parts of the oil and gas industry. For example, some companies are trying to pivot their business models into a carbon-neutral energy company. It means they no longer invest in traditional oil and gas fields as much anymore. Instead, they now focus more on renewable energies. Some even go as far as closing or selling some of their refineries.
Types and frequencies of losses within the oil and gas industry
Losses in the oil and gas industry can vary from fires to flooding events, depending on the area. On average, North America experiences ten significant events, 20 major events, and approximately 500 mid-market events per year. Large events are newsworthy on a national scale and usually result in loss of life. Major events often receive coverage in the local news, while mid-market events rarely receive news coverage. It is important to note that the claim size increases with each event size.
Energy losses due to the nature of production and manufacturing are usually complex. The origin and cause are highly technical, and this industry’s damaged property is unique.

Figure 5: Alesco’s energy, power, and renewables market update (June 2021). Source: Alesco Europe
Figure 5 provides a global perspective of the magnitude of energy-related claims. For example, a vapor cloud explosion (VCE) often involves a heavy gas coming out of the pipeline and coating an area until it reaches an ignition source. As indicated above, the top 10 losses make up a little over 60% of the total downstream losses.
Typical causation categories
- Lack of proper maintenance – Refineries have several fixed costs, but some neglect preventative maintenance fees. Regular maintenance is essential in refineries because some of the equipment is old, making it prone to failure if improperly maintained.
- Human error on the operator’s part – A wrong decision by an equipment operator could lead to loss. Many of these failures occur during a transient state where an operator transports an asset for maintenance and removes or adds heat energy from the plant.
- Human error on the part of a contractor – These losses usually occur when the equipment is already malfunctioning, resulting in the retainment of a contractor to fix it.
- Weather events can include hurricanes, tornadoes, and damage caused by fires due to climate change.
- Design defects – Manufacturing defects can result in components and systems malfunctioning. In the petroleum and petrochemical industry, a design defect can significantly impact the asset because there are very highly integrated pieces of equipment and plants involved.
Types of claims
In most claims, investigators determine the origin and cause of loss, conduct damage assessments, and provide a repaired timeframe. Petrochemical systems contain highly specialized assets, which require a high level of knowledge to evaluate failure mechanisms. As such, it’s crucial to retain an expert in all damage claims. In addition, a damage assessment provides an accurate estimation of the cost to repair. Without specialized experience, it’s hard to ascertain how much a loss would cost and how long it would take to repair. In cases where the damage is to an old piece of equipment, there’s usually a discussion about whether to repair or replace an asset.
In addition to the above, an experienced adjuster is better positioned to tell if there is a potential for subrogation on these types of claims. There are often subtle differences between claims, as several types of claims can be found in the petrochemical industry. These are:
- Property damage (PD)
- Construction All Risks (CAR)/ Delay in Startup (DSU)
- Business interruption (BI) – A typical U.S. refinery has a daily profit of US$1 million. For significant and large losses, repairs typically take 6 to 18 months. In such instances, claims could reach up to US$180 million.
When considering the BI for an energy asset, the following aspects could warrant expert examination:
- Duration of the repair period and intermingling of non-loss-related works.
- Commodity pricing and consumption as well as production costs
- Market distortion
- Contingent Business Interruption (CBI) – A typical chemical plant has six “take or pay” raw material supply contracts and a similar number of product sales contracts. This can easily represent twelve potential CBI claims resulting from a single loss. When considering CBI claims for an energy asset, the following aspects could warrant expert examination:
- Duration of repair period and the lack of information relating to the primary PD claim to measure the repair period.
- Commodity pricing and consumption
- Market distortion
The significance of scene documentation
The damage can be significant in energy losses, and the repair process can be lengthy. And so, it is essential to diligently document conditions immediately after the loss. Photos are a vital part of the documentation process.
You can use laser scanning, 360 spherical photos, or even drones to capture the scene accurately. Images can be beneficial in the claim as the rebuild process gets underway. They can help validate the scope of what was done versus what had been in place at the time of the loss.
There are a lot of aging refineries whose documentation and drawings may not be as robust as some of the newer builds. So, having photos to help piece things together after the fact can be huge. Document through photo logs as much as possible when you can access the site.

Figure 6: A site photo captured on a 360 spherical camera.
Common objectives for energy losses
- Validating the extent of damages
This objective refers to the extent to which damage merits a repair or replacement of the equipment and identifying where repairs or replacements are made based on non-loss-related causes.
One would need to validate damages to understand the nature of the loss and then interpret the damages with this understanding. It makes it possible to segregate the damage that occurred due to the event from what might be the result of a pre-existing condition. This step requires in-depth analysis, especially on larger equipment.
It is also crucial to understand the damage to the supporting components of these pieces of equipment, such as the electrical instrumentation, structural steel, and concrete piping.

Figure 7: A major piece of equipment requiring repair (left) and its supporting disciplines (right).
While the reactions and money-making processes come from the big pieces of equipment, the actual replacement cost and time for setting them are generally far less reaching than the replacement of the supporting components. So, more time is often spent on identifying the supporting disciplines and quantities and the extent of the damage. It provides an accurate understanding of what that means in terms of replacement in kind for the insured.
Some of the causes of petrochemical fires can impact the repair process, particularly in supporting disciplines like piping and electrical. And so, they need to be evaluated and highlighted to the adjuster for their application of policy coverage. Getting the material quantity list in a solid state is crucial as early as possible because the rest of the process will become contingent on it.

Figure 8: A simplified guide to determining a material quantities list when validating damages.
At times, the insured might consider losses as an opportunity to fix pre-existing issues, in addition to the damages sustained in the loss. Referred to as opportunity work, this is out of scope for the insurer. If all these quantities are ordered from the same vendor and at the same time and installed by the same labor vendors, then the cost for the additional unrelated work could quickly become included in the claim. Therefore, an initial quantities list where you have identified what was damaged in the loss and merits replacement, makes it easy to identify these exceptions.
- Estimating the cost of repair
This objective relates to using the list of damaged property to determine the cost of putting the insured back in their position before the loss. This requires identifying a baseline cost associated with the specified repairs for materials, labor, and equipment. In addition to this, an adjuster also identifies buckets of expenses that may need to be incurred but could be subject to policy interpretation. This estimate would typically be the basis for setting a reserve for the loss and serves as an anchor to the claim.
Cost estimation takes the detailed line items that make up the material quantity summary and applies industry metrics for cost and installation rates and the cost of the supporting disciplines and crafts.
In any industry, it’s essential to understand how insurance companies plan, approach, and manage their rebuilds, so that you can more adequately align your parallel process. This way, you are determining an independent cost valuation on the one hand, and the insured is planning their cost valuation on the other. In doing so, you can easily understand and bridge the variances between those two when they arise.
Refineries and chemical plants primarily utilize software called Aspentech for their production optimization and cost estimation. It is the industry-leading software for process simulation and estimating. Using Aspentech, your estimated output would be very aligned to the insurance in terms of metrics, unit cost assumptions, and labor unit assumptions. It then becomes easier to see divergences in the estimates.
- Timeline analysis for the duration of repairs
The timeline is always required for DSU, BI, or CBI claims. It applies even to claims without business interruption coverage because the length of time repairs are undertaken can impact claim-related costs. In addition, this schedule provides a way for the adjuster to anchor the BI or DSU claim period and the associated costs based on the number of days, months, or years the repairs could take after physical damage.
Most insureds build their schedules in Primavera. And this would be another area where one should run the same software and methodologies so that schedules and variances could be tested more robustly.

Figure 9: A typical schedule for energy claims.
This kind of analysis goes beyond understanding the quantity and sequencing of work. As such, you must be diligent in documenting assumptions because these are the areas where you might see a lot of resistance from an insured.
Other conflicts can arise over assumptions on the density of workforce on site or how much factors like weather conditions might impact the productivity of the work crews. You can even reference an industry-standard in such cases.
Once this initial basis is set, one must understand the actual sequence of events as they occur during the rebuild period. Then, they must identify those within the scope of the damage repairs and those out of range but still undertaken by the insured. Moreover, they must determine how the time for these is accounted for.
These situations require extensive knowledge of contemporary works and how much time this caused the work to be extended. Time for opportunity works is considered out of scope by the insurer and adjuster. You might also be tasked with determining the different buckets of timeline impact from this type of event.

Figure 10: A diagram showing the timeline analysis of two plants.
Figure 10 is a high-definition view of a timeline analysis report. Such diagrams can help identify where the damage and the associated repairs could disrupt normal operations.

Figure 11: A timeline view of the connected plants and units.
Complex losses and heavy data
Across many industries, companies are moving to more data-heavy record-keeping to control costs and manage operational drivers. With these transitions, the claims documentation and process on significant complex losses have become more aligned with this big data, and less with a standard paper, invoice billing, and documentation. While this means that a claim can be presented with 50,000-line items, it also means that you can leverage that data to gain critical insights into the scope and scale of the repair works with the right tools and skill sets.
Creating relationships between these various data sources can break big claims into manageable, understandable pieces for the adjusters to correctly allocate the cost and scope as per their policy definitions.
- Scrubbing expenses claimed for scope
This objective is related to the detailed analysis of the cost claim to ensure that they are aligned with the defined scope of damage and repairs. The standard for these types of claims is for the insured to present large information data sets.
More companies in the energy space are using a “Track” system as their primary cost system. The track is a gait logging system where vendors’ time is logged to a particular location, work order, or purchase order based on where and when they physically badge in and out. It enables their time to be approved quickly and electronically by the company supervisors and for the wage rates and the number of hours to be accurately applied based on the contracts with that vendor.

Figure 12: An example of a Track process.
This system is prevalent because it is a cost and time saver for the companies that use it, and no paper invoices are produced for this type of labor. Instead, the vendor bills their employee labor, materials, and equipment through Track, based on the insured’s designated purchase and work orders. When the insured receives these costs, they’re designated to the appropriate place in the financial system, and an extract is provided to the claim with these line items.

In the curves above, we conducted data analysis based on different wage classes of workers. It helped us construct a visualization of what type of work was going on and when, and the man-hours associated with each discipline. We could then compare these with industry metrics to get a basis for what types of quantities they would likely be associated with.
In figure 13, red indicates demolition-related work, and green indicates electrical and instrumentation installation. This data view is particularly insightful and meaningful because it allows us to highlight areas where more information may be required from the insured to validate the costs.
Figure 14: A visualization of data analysis leveraging.

Figure 14 is an example of how you could leverage data analysis to bring attention to items unrelated to the damage scope. The chart shows the number of loop checks done to verify the functionality of electrical and instrumentation runs done as a pre-commissioning step before startup. This allows us to see operations conducted before or after the loss so those could be excluded from the claim. When reviewing a claim on an invoice-by-invoice basis, these insights can be challenging to find.
This type of analysis is beneficial on large complex claims where a tremendous amount of data, costs, and significant cost exposure needs to be managed appropriately.
Key messages
- A material quantities list is vital when validating the extent of damages.
- When estimating the repair cost, align processes and systems to the insured.
- Assumptions are critical when determining a timeline for the duration of repairs.
- Leverage significant data insights when scrubbing expenses claimed for scope.
OCI Group: Your Choice of Investigative Partner
Petrochemical fires could be tricky and complicated to unravel and understand. Our team at OCI Group is well equipped and well-versed in the field of petrochemical fires and how to conduct an investigation to find out the root cause of the fire or explosion. We offer concrete answers based on facts and all conclusions are formed only after verification of facts. Contact OCI Group at 1-888-624-3473 today to help us assist you with your claim.